
Major inequalities in both nominal and purchasing power terms reveal the data from the OECD report. According to this, average annual gross wages showed strong differences throughout Europe in 2025.
In terms of purchasing power the image is significantly improved, reaching $50,974
The gap decreases when purchasing power is taken into account, however the distance between countries with higher wages and those with the lowest It remains great.
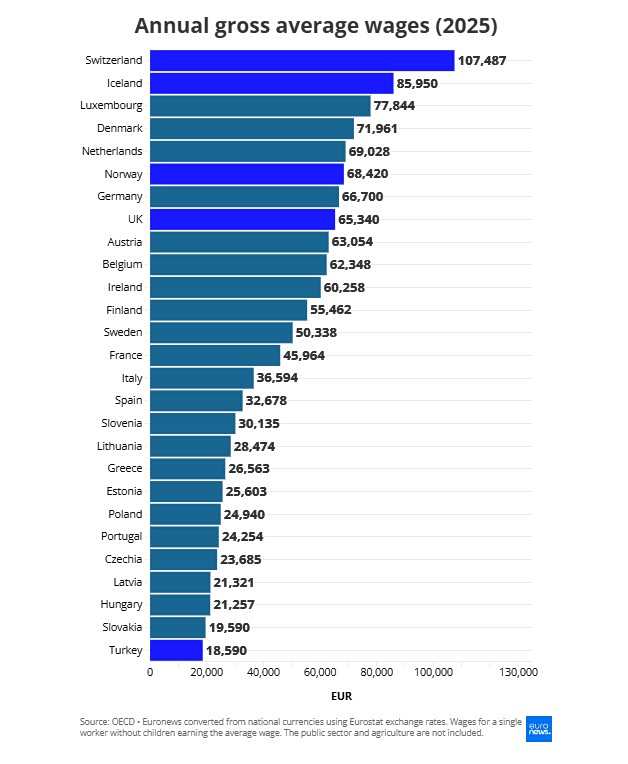
According to the report «Taxing Wages 2026» the OECD average annual gross salary starts at EUR 18,590 in Turkey and reaches EUR 107,487 in Switzerland. The figures relate to 27 European countries, 22 of which are members of the European Union (EU).
Switzerland looks at the top and is the only country where the average gross salary exceeds EUR 100,000. The following is Iceland in second place with EUR 85,950. In all EU countries, Luxembourg is at the top of EUR 77,844, taking third place in all countries under examination.
It is worth noting that Luxembourg has the highest per capita GDP in the EU with 92,200 euros, well above its average (EUR 38,100) and accounts for 0.5% of its total GDP, according to the official Union website.
OECD: Fraction between north-west and south-east Europe
According to the OECD report, Denmark (EUR 71,961) and the Netherlands (EUR 69,028), while Norway is near, with EUR 68,420.
Germany is next with EUR 66,700, first among Europe's five largest economies, and the United Kingdom with EUR 65,340. The other three major economies are significantly lower.
France records an average annual gross salary at EUR 45,964 and Italy at EUR 36,594. Spain is at EUR 32,678, half of which is lower than in Germany and the United Kingdom.
Austria (EUR 63,054), Belgium (EUR 62,348), Ireland (EUR 60,258), Finland (EUR 55,462) and Sweden (EUR 50,338), all over EUR 50,000.
Under 30,000 euros are nine of the 22 EU countries, including Greece (26,563 euros), while Slovenia is on the 30,135 euros threshold. Slovakia has the lowest annual wages in the EU, with 19,590 euros, followed by Turkey.
Our country lies between Lithuania, which has an average annual gross salary of EUR 28,474 and Estonia of EUR 25,603. Under 25,000 euros are Hungary (EUR 21.257), Latvia (EUR 21.321), the Czech Republic (EUR 23.685), Portugal (EUR 24.254) and Poland (24,490).
In nominal terms, the countries of North and Western Europe occupy the top positions of the ranking, while the countries of South and Eastern Europe are concentrated in the last positions. Major variations in classification are observed when considering purchasing power.
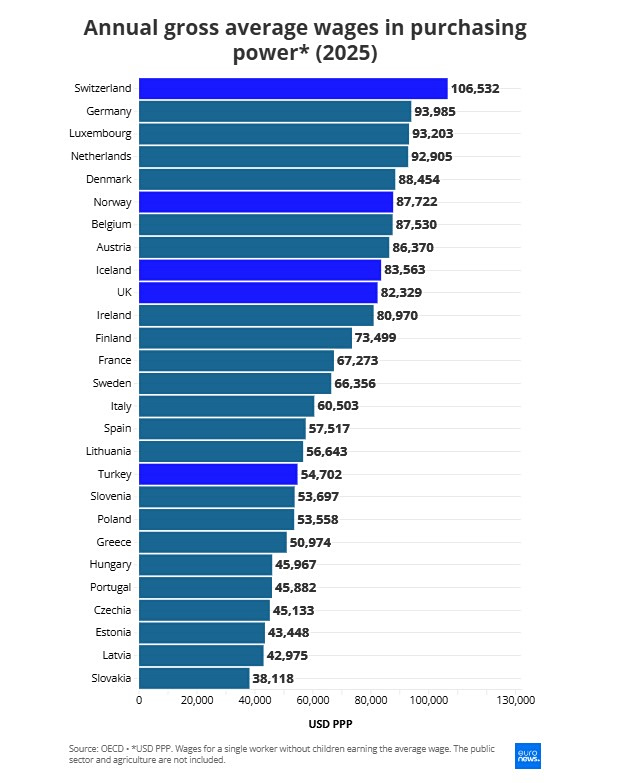
Typical is the case of Greece, which, while in nominal terms is in the last positions between the EU countries, in terms of purchasing power the image is significantly improved, reaching $50,974 (the figures presented here are based on US dollar, as those based on the euro have not yet been published).
However, behind these figures lies a long course of shrinking. According to OECD data, real wages on PPP terms in Greece have decreased by 21.2% since 2010 – when the economic crisis broke out – making the country a unique exception to developed economies. It is no coincidence that while increasing the minimum wage at rates that, at first reading, show an improvement in income, in practice remains in the EU's last positions in terms of purchasing power, along with Bulgaria.
What determines wage differences between countries
International Labour Organisation (ILO) experts report to Euronews, which shows OECD data, that wage differences in Europe largely reflect the impact of three factors: productivity and economic structure, labour market institutions and living costs.
Countries with high added value sectors, such as finance and technology, tend to offer higher wages, as do those with strong trade unions and collective bargaining. Higher price levels also usually push nominal wages upwards.
In purchasing power terms, the wage gap in Europe decreases compared to nominal figures. The purchasing power rate (PPP) corrects the «distortion» because of the different currencies, eliminating differences in price levels between countries.
In PPP terms, annual average gross wages range from 38,118 in Slovakia to 106,532 in Switzerland. Germany (93.985), Luxembourg (93.203) and the Netherlands (92.905) exceed all 90,000. Denmark (88.454) and Norway (87.722) follow closely.
Among Europe's five largest economies, rankings remain unchanged in nominal terms. However, the distances between them are changing. The United Kingdom is at 82,329 and France at 67,273, while Italy reaches 60,503 and Spain is 57,517.
When comparing denomination-based rankings and those based on purchasing power parity (PPP), Turkey notes the biggest rise, rising nine places – from the last to the 18th. Germany also rises five places, from 7th to 2nd.
The biggest fall is Iceland, which fell from 2nd to 9th place, and Estonia, from 20th to 25th.
Estimates for the average salary relate to full-time workers in selected industries, mainly in the public sector. They cover most of the economy, including manufacturing, construction, retail, transport, financial services and other business services, but exclude agriculture, public administration, education and health.
It should be noted that since the income tax rates of natural persons vary considerably across Europe, net wages may differ considerably from gross amounts.

